DNA Quantification Battle: Why Qubit Tops Nanodrop?
Key Comparisons
- Sensitivity: Fluorometry detects very low, picogram-to-nanogram amounts, whereas spectrophotometry works best for quick, high-concentration DNA samples, determining purity, or routine, high-throughput checks where high, precise accuracy is less critical.
- Specificity: Fluorometric dyes are highly specific to DNA or RNA, ignoring impurities and contaminants. Spectrophotometry measures total absorbance at 260nm, which could be affected by contaminants.
- Purity Assessment: Spectrophotometry provides ratios to assess contaminations. Fluorometry does not provide purity data.
Quantification for Qubit Fluorometer
Quantification Kits for Microplate Reader
Introduction
Accurate quantification of DNA is essential for molecular biology applications. Two widely used techniques for DNA quantification are spectrophotometry (e.g., Nanodrop) and fluorometry (e.g., Qubit fluorometer). Spectrophotometric methods estimate nucleic acid concentration based on ultraviolet (UV) absorbance at 260 nm, whereas fluorometric methods employ DNA-binding fluorescent dyes that selectively detect DNA or RNA.
While spectrophotometry provides rapid quantification and assessment of sample purity, fluorometry offers superior sensitivity and specificity. The choice of method depends on the downstream application and required level of accuracy.
How DNA Quantification is measured?
Spectrophotometry (Nanodrop)
Mechanism
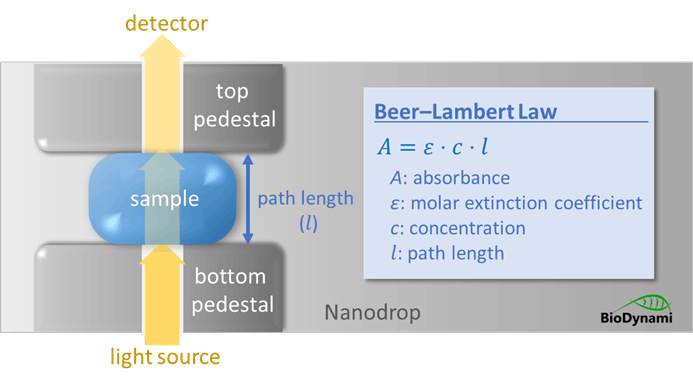
DNA absorbs ultraviolet light maximally at 260 nm due to the aromatic ring structures of purine and pyrimidine bases. Quantification is based on the Beer–Lambert law, where an absorbance of 1.0 at 260 nm corresponds to approximately 50 µg/mL of double-stranded DNA.

- Extinction coefficients
- dsDNA: 50ng-cm/µl
- ssDNA: 33ng-cm/µl
- RNA: 40ng-cm/µl
- Extinction coefficients
Purity Ratios and Contamination Assessment
A key advantage of spectrophotometry is simultaneous purity evaluation via absorbance ratios:
- A260/A280 ratio: ~1.8 for pure DNA; ~2.0 for pure RNA; lower values indicate protein contamination
- A260/A230 ratio: ~2.0 for pure DNA/RNA; lower values indicate contamination by salts, phenol, or carbohydrates

Contaminants affect the quantification accuracy
These ratios provide qualitative insight into extraction efficiency and sample integrity. However, spectrophotometry cannot distinguish between DNA and RNA, nor between intact and fragmented nucleic acids. Accuracy is another major concern.
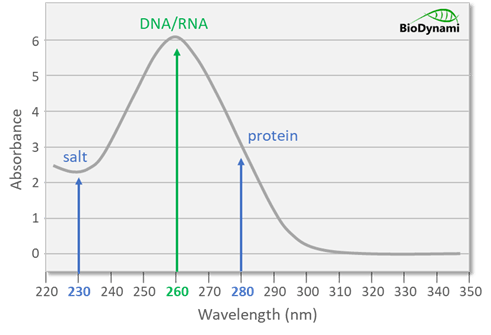
While nucleic acids absorb maximally at 260 nm, contaminants that absorb near this wavelength affect accuracy. Solvents such as salt, guanidine, and phenol have maximal absorbance around 230 nm, while proteins absorb maximally around 280 nm. These absorbance peaks artificially inflate readings at 260 nm. Moreover, dsDNA, ssDNA, RNA, short oligos, and free nucleotides cannot be distinguished from one another in samples.
Fluorometry (Qubit)
Mechanism
Fluorometric quantification utilizes fluorescent dyes that selectively bind to double-stranded DNA. Upon binding, fluorescence intensity increases proportionally to DNA concentration. Instruments such as the Qubit Fluorometer are commonly used with nucleic acid quantification kits for dsDNA, ssDNA, RNA, and short oligos.
Contaminants do not significantly contribute to the signal due to the specificity of dye binding. A standard curve generated from DNA standards is used to determine sample concentration. Compared to spectrophotometric methods, fluorescence demonstrates better accuracy because it is less affected by other sample components. As a result, fluorescence is a more reliable method for nucleic acid quantification.
Fluorescent Dye Binding: Excitation and Emission
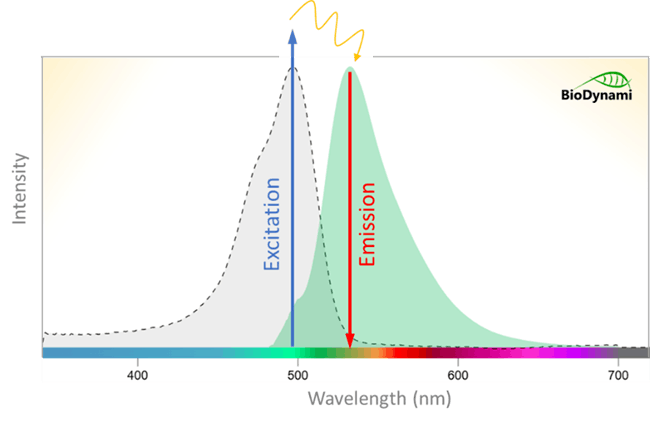
Fluorometry measures signals emitted from fluorogenic molecules called fluorophores. When a photon of excitation light is absorbed by an electron of a fluorophore, the electron’s energy level rises to an excited state. Some energy is dissipated, and the remaining energy is emitted after excitation. The emitted photon has a longer wavelength than the excitation photon because it carries less energy, allowing the emitted fluorescence to be distinguished from excitation light using a fluorometer.

Fluorescent dye-based quantification uses dye molecules that bind to nucleic acid. Fluorometric assays use dyes that exhibit minimal fluorescence in solution but emit strong fluorescence upon binding to nucleic acid. For example, when a dsDNA dye is excited by a given wavelength of light, only dye molecules bound to dsDNA fluoresce. Signal intensity correlates directly with the amount of dye bound to nucleic acids, making fluorescence quantification accurate and specific—ideal for nucleic acid quantification.
Unlike spectrophotometry, fluorometry requires calibration against known DNA standards. Fluorescence measurements are plotted against concentration to generate a standard curve, from which sample concentrations are interpolated. This method enhances quantitative accuracy but introduces potential variability if standards are improperly prepared.
Type-specificity of Qubit quantification reagents
The Qubit quantification reagents are optimized and are specific to one type of the nucleic acids:
- dsDNA (Broad Range and High Sensitivity)
- ssDNA
- RNA (Broad Range and High Sensitivity)
- microRNA
- Short oligo
The dsDNA Quantification Broad Range Kit measures dsDNA concentrations in the range 100 pg/uL – 1,000 ng/uL. The dsDNA Quantification High Sensitivity Kit quantify dsDNA in the range 10 pg/uL – 100 ng/uL. These two kits are very popular in labs for routine DNA quantifications.
The fluorescent dyes do not bind to contaminants and impurities such as salts, solvents, proteins, dNTPs, phenol, ethanol, or guanidine. Thus, Qubit assays can selectively measure nucleic acid concentrations even in the presence of contaminants.
Advantages and Limitations
Spectrophotometry (Nanodrop)
Advantages:
-
- Rapid and simple
- No reagent costs
- Provides contamination ratios
Limitations:
-
- Overestimates DNA concentration
- Interference from contaminants absorbing at 260 nm
- Reduced accuracy at low DNA concentrations
Fluorometry (Qubit)
Advantages:
-
- Superior sensitivity
- Minimal interference from contaminants
- Greater accuracy, even for low-concentration samples
Limitations:
-
- Requires consumable reagents
- Does not provide purity ratios
- Slightly longer processing time
Comparative Evaluation
Spectrophotometry | Fluorometry | |
Detection principle | Absorbance at 260 nm | Fluorescent dye binding to DNA/RNA |
Specificity | Low | High |
Sensitivity | 5–10 ng/µl detection limit | pg/µl detection range |
Accuracy at low concentrations | Limited | High |
Purity assessment | Yes (260/280, 260/230) | No |
Reagent requirement | No | Yes |
Time required | Fast | Moderate |
- Sensitivity and Detection Limits: Fluorometry consistently outperforms spectrophotometry in sensitivity. While spectrophotometry becomes unreliable below ~5–10 ng/µl due to limited signal-to-noise ratio, fluorometric assays maintain accuracy at concentrations several orders of magnitude lower. This difference is particularly significant in applications involving limited DNA input, such as forensic analysis or single-cell sequencing.
- Specificity: Spectrophotometry measures total absorbance from all nucleic acids and UV-absorbing contaminants. Fluorometry selectively detects DNA or RNA, providing more accurate quantification.
Nanodrop (ng/µl) | Qubit (ng/µl) | Nanodrop/Qubit ratio | |
Sample 1 | 13.9 | 4.9 | 2.84 |
Sample 2 | 23.5 | 17.8 | 1.32 |
Sample 3 | 27.4 | 8.26 | 3.32 |
Sample 4 | 98.4 | 17.8 | 5.53 |
Sample 5 | 35.1 | 14.3 | 2.45 |
Sample 6 | 87.5 | 23.8 | 3.68 |
Sample 7 | 86.3 | 72.3 | 1.19 |
Sample 8 | 48.3 | 32.5 | 1.49 |
Several reports comparing DNA quantitation using fluorometric and spectrophotometric methods (Qubit vs. Nanodrop) show that spectrophotometry consistently overestimates DNA concentration. BioDynami has observed similar patterns, with Nanodrop overestimating most DNA samples compared to Qubit values (above data). This discrepancy is common and typically results from contamination.
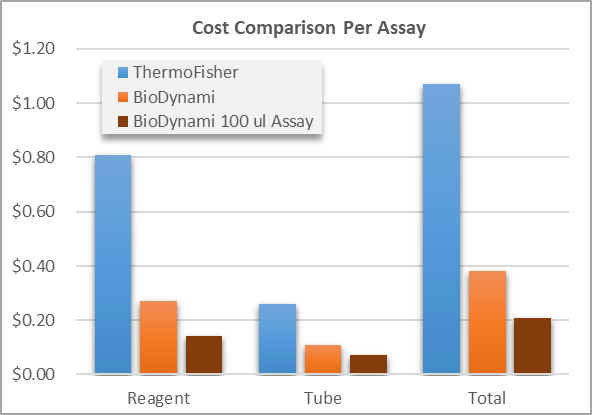
- Cost: Spectrophotometry offers low per-sample cost and rapid throughput. In contrast, fluorometric assays require consumable reagents and standards, increasing operational cost. However, the financial cost of inaccurate quantification—particularly in NGS—may exceed the additional reagent expense associated with fluorometry.
To help reduce cost burden for labs using Qubit kits, BioDynami has released kits at very competitive prices. Reagent costs range from 17–33% compared to ThermoFisher kits.

Vendor | Cat.# | Kit | Assay volume | Assay tube type | Assay tube adaptor | Cost/assay | Cost percentage | High-through compatibility | ||
Reagent | Tube | Total | ||||||||
ThermoFisher | Q32853 | BR & HS kits | 200 µl | 500 µl | Not required | $0.81 | $0.26 | $1.07 | 100% | No** |
BioDynami | 40041L 40042L | BR & HS kits | 200 µl | 500 µl | Not required | $0.27 | $0.11 | $0.38 | 33%* | No** |
BioDynami | 40211L 40212L | BR & HS kits (100-µL assay) | 100 µl | 150 µl | Required | $0.14 | $0.07 | $0.21 | 17%* | Yes** |
*Â Compared to ThermoFisher kits
**Â Assay tubes can be prepared in 96-well plate racks
Applications
- Routine Molecular Biology: For routine DNA extraction quality control, spectrophotometry remains practical due to speed and purity assessment capability. For the applications that require accurate nucleic acid quantification such as NGS and PCR, fluorometric method is the choice.
- Clinical and Diagnostic Settings: In clinical diagnostics, where accuracy and reproducibility are paramount, fluorometric methods are generally preferred.
- Low-Yield and Forensic Samples: Low-concentration or degraded samples benefit significantly from fluorometric quantification due to enhanced sensitivity.
- Combined Methodology: Many laboratories adopt a complementary strategy:
- Spectrophotometric analysis for purity evaluation
- Fluorometric measurement for accurate DNA quantification
This dual approach mitigates limitations inherent to each individual method.
Conclusion
The literature demonstrates that spectrophotometry and fluorometry serve distinct but complementary roles in DNA quantification. Spectrophotometry offers rapid assessment and valuable purity metrics but is limited by lower specificity and sensitivity. Fluorometry provides superior analytical performance, particularly for low-concentration and precision-critical applications such as NGS and qPCR.
In modern molecular workflows, fluorometry is increasingly considered the gold standard for accurate dsDNA quantification, while spectrophotometry remains useful for preliminary quality assessment. Optimal practice often involves integration of both techniques to ensure both purity and quantitative accuracy.
Â
Â
Â
Background info